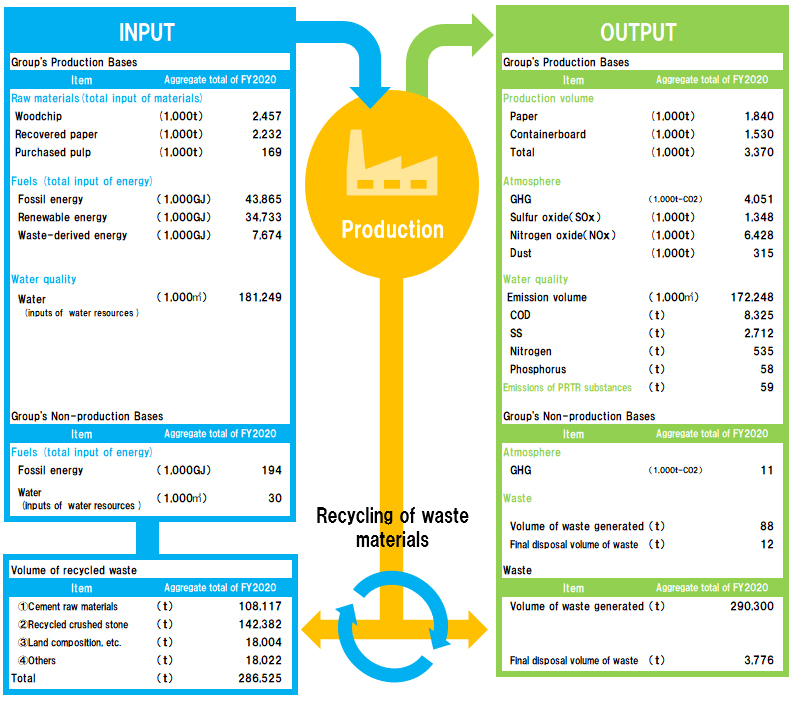
Material Flow
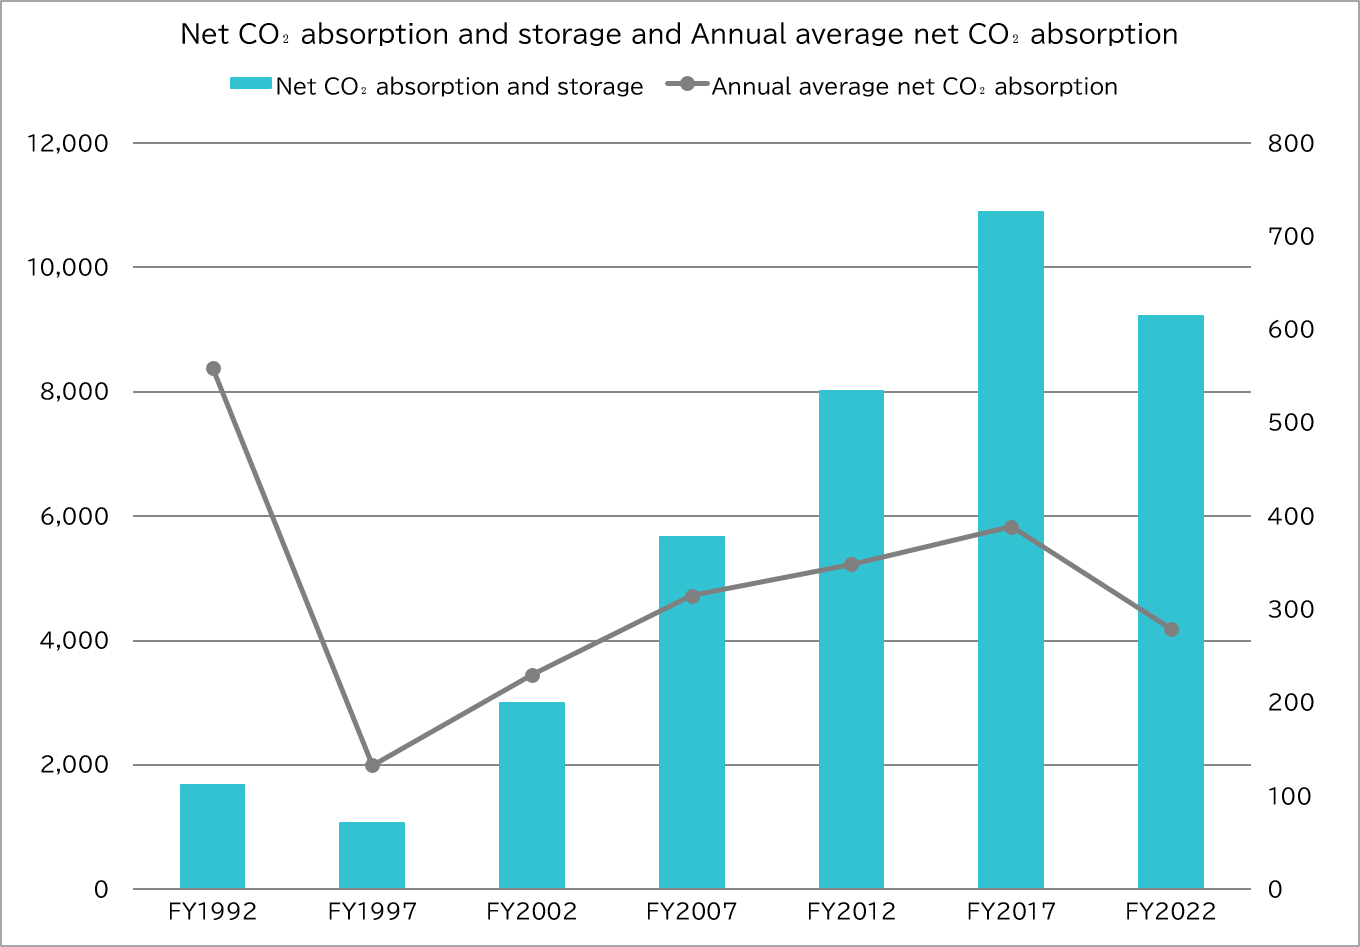
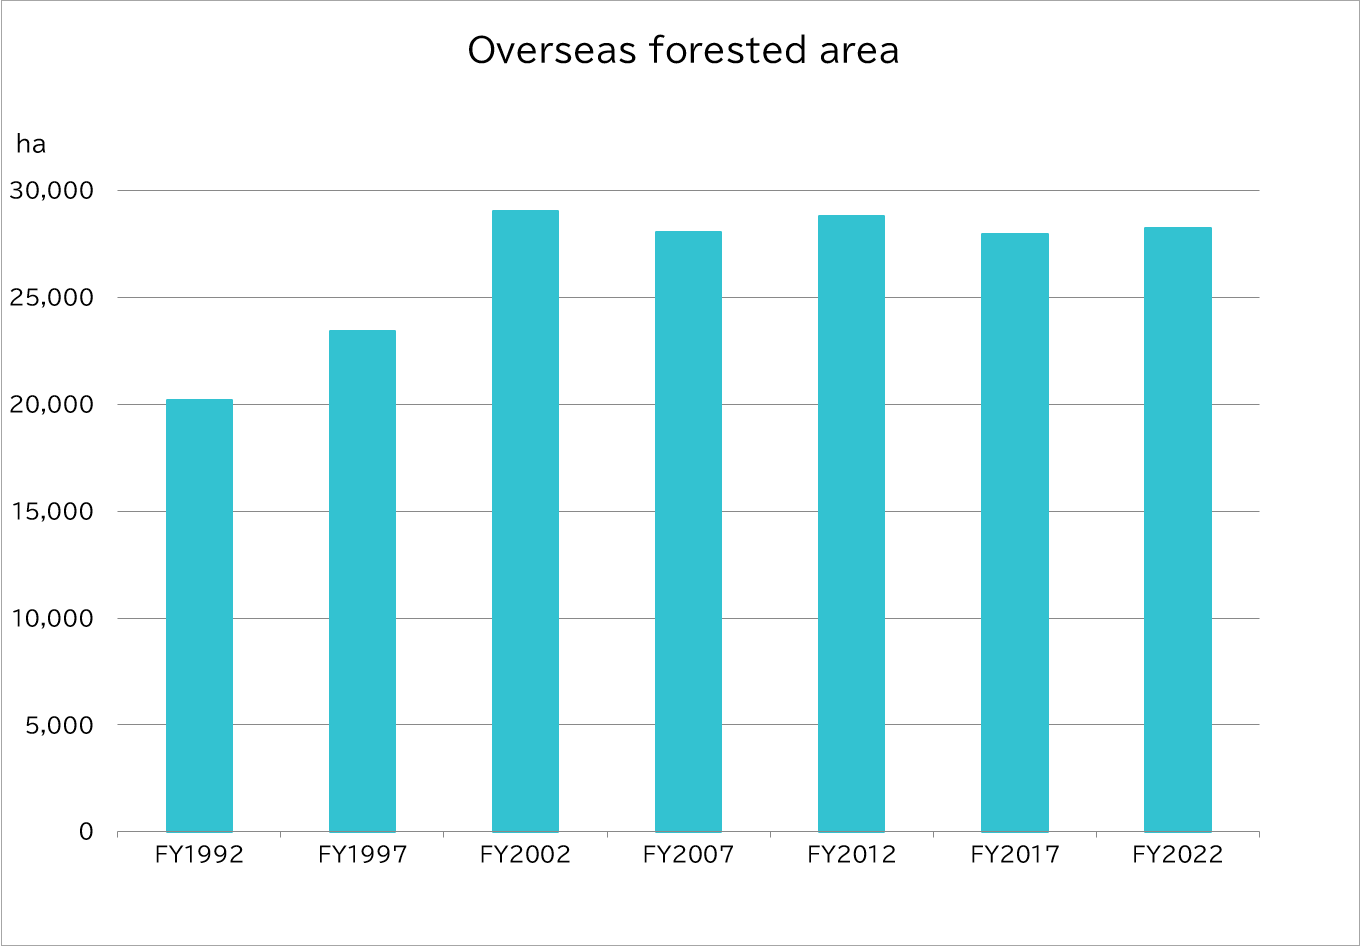
Absorbing and Storing Carbon Dioxide by Expansion of Forestry Area
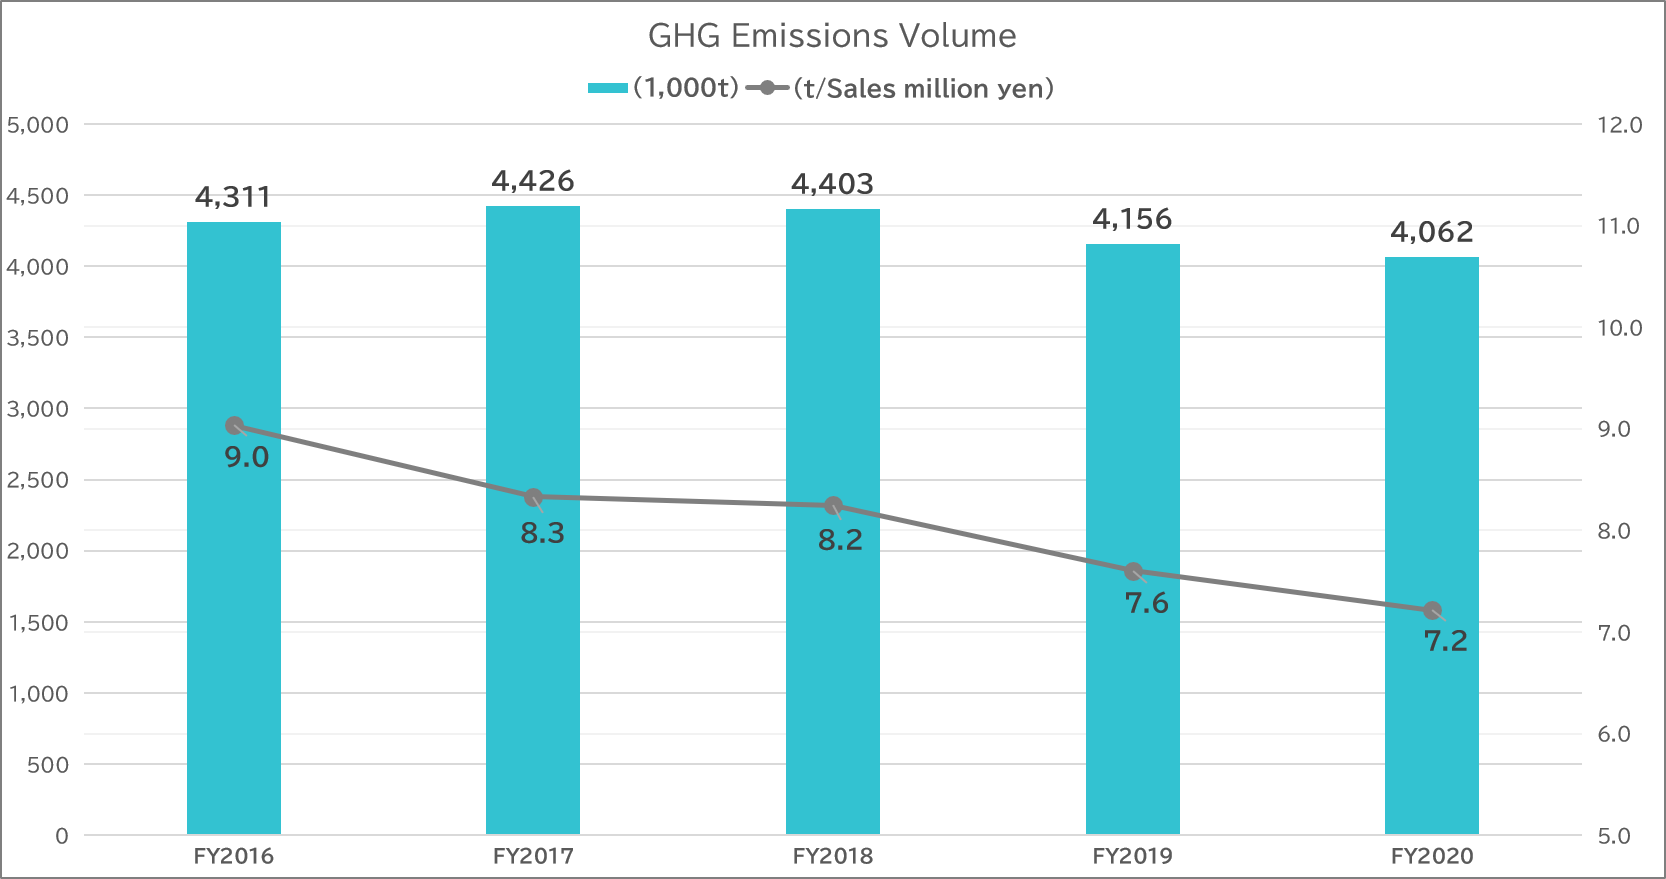
Trends in Greenhouse Gas (GHG) Emissions
The Daio Group aims to achieve carbon neutrality by 2050 and has set a target of reducing carbon dioxide emissions in FY2030 by 46% compared to FY2013 levels. We are currently preparing for information disclosure based on the TCFD recommendations. One of the three coal-fired boilers at our Mishima Mill will be shut down by FY2030. We subsequently plan to utilize biomass and waste-derived fuels to continue lowering our dependence on coal.
Air Quality Data
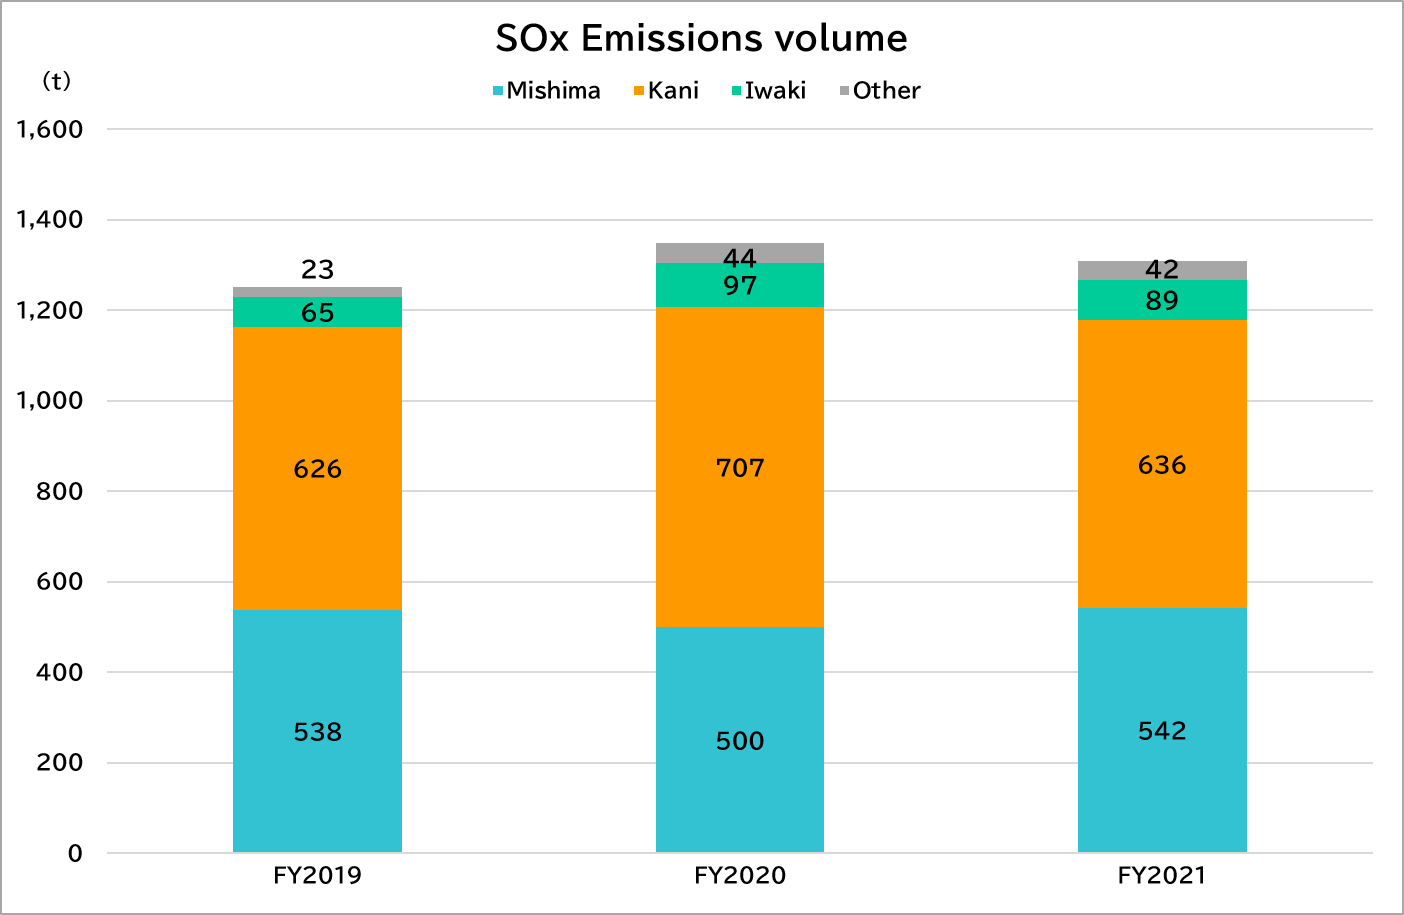
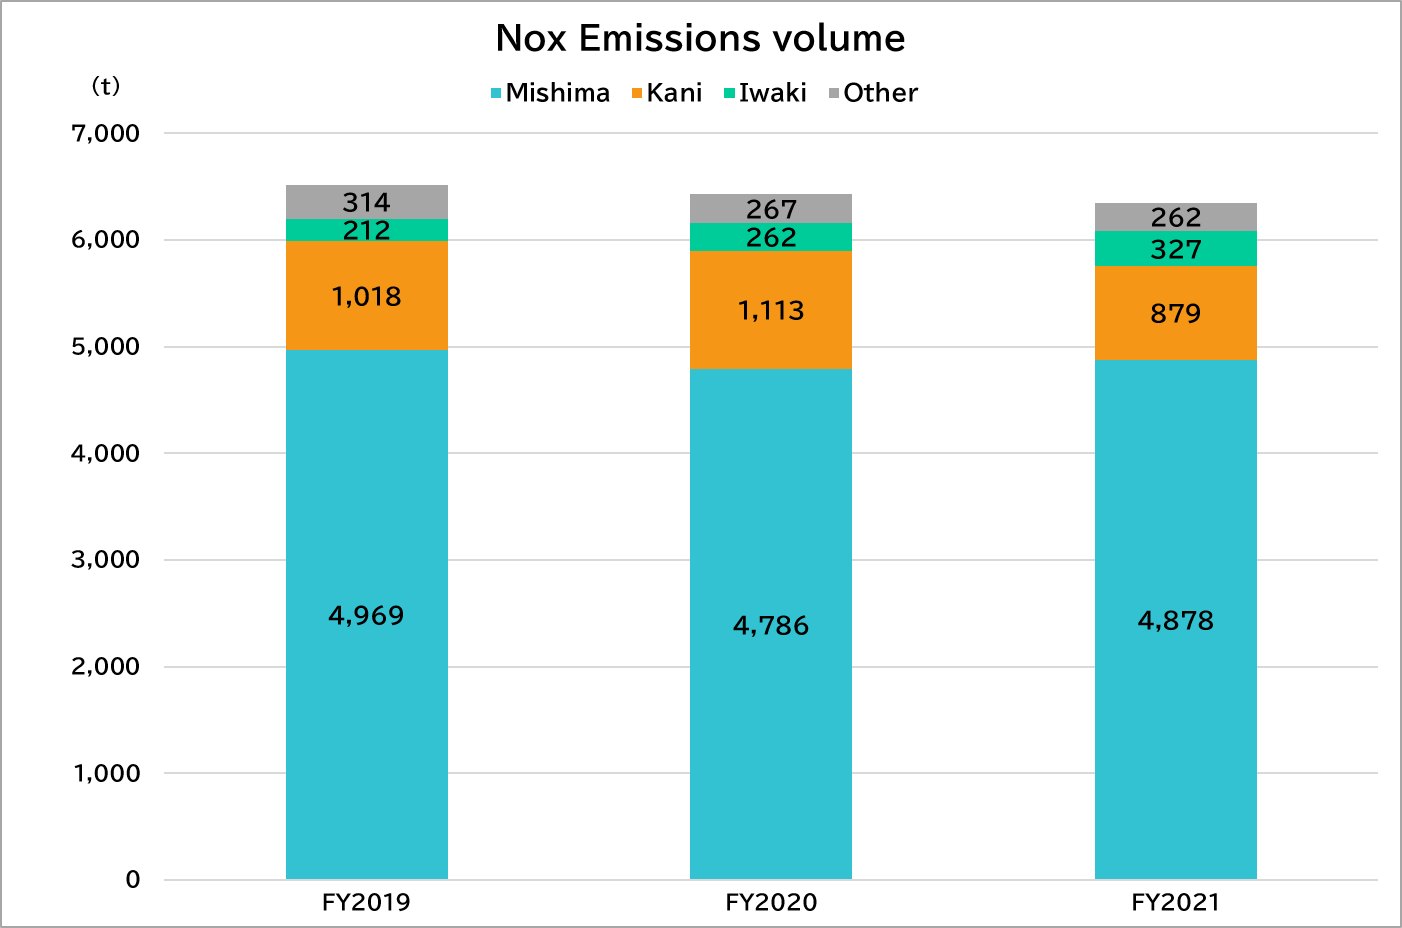
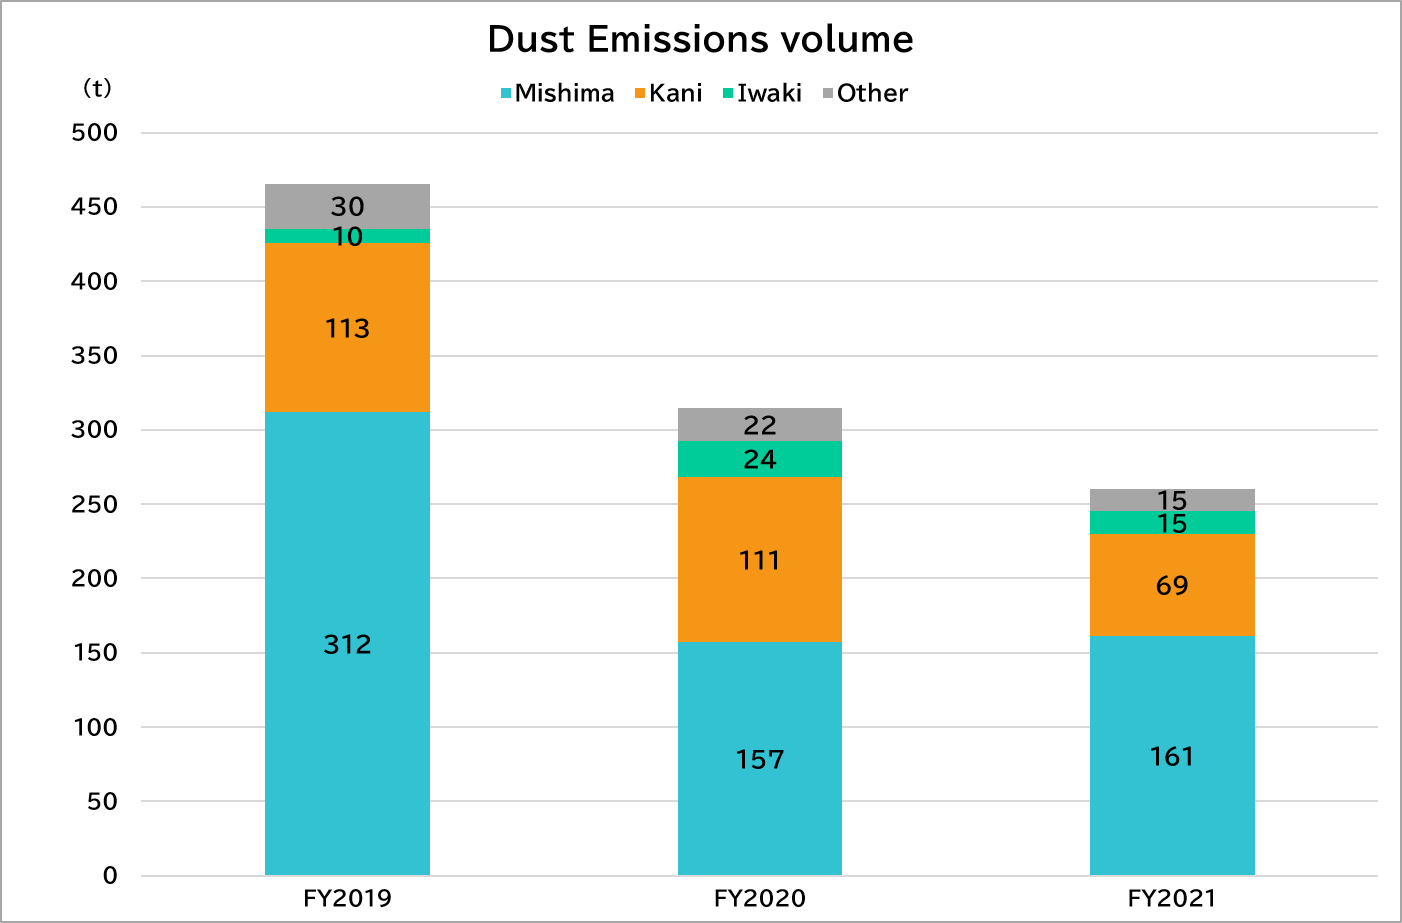
Water Quality Data
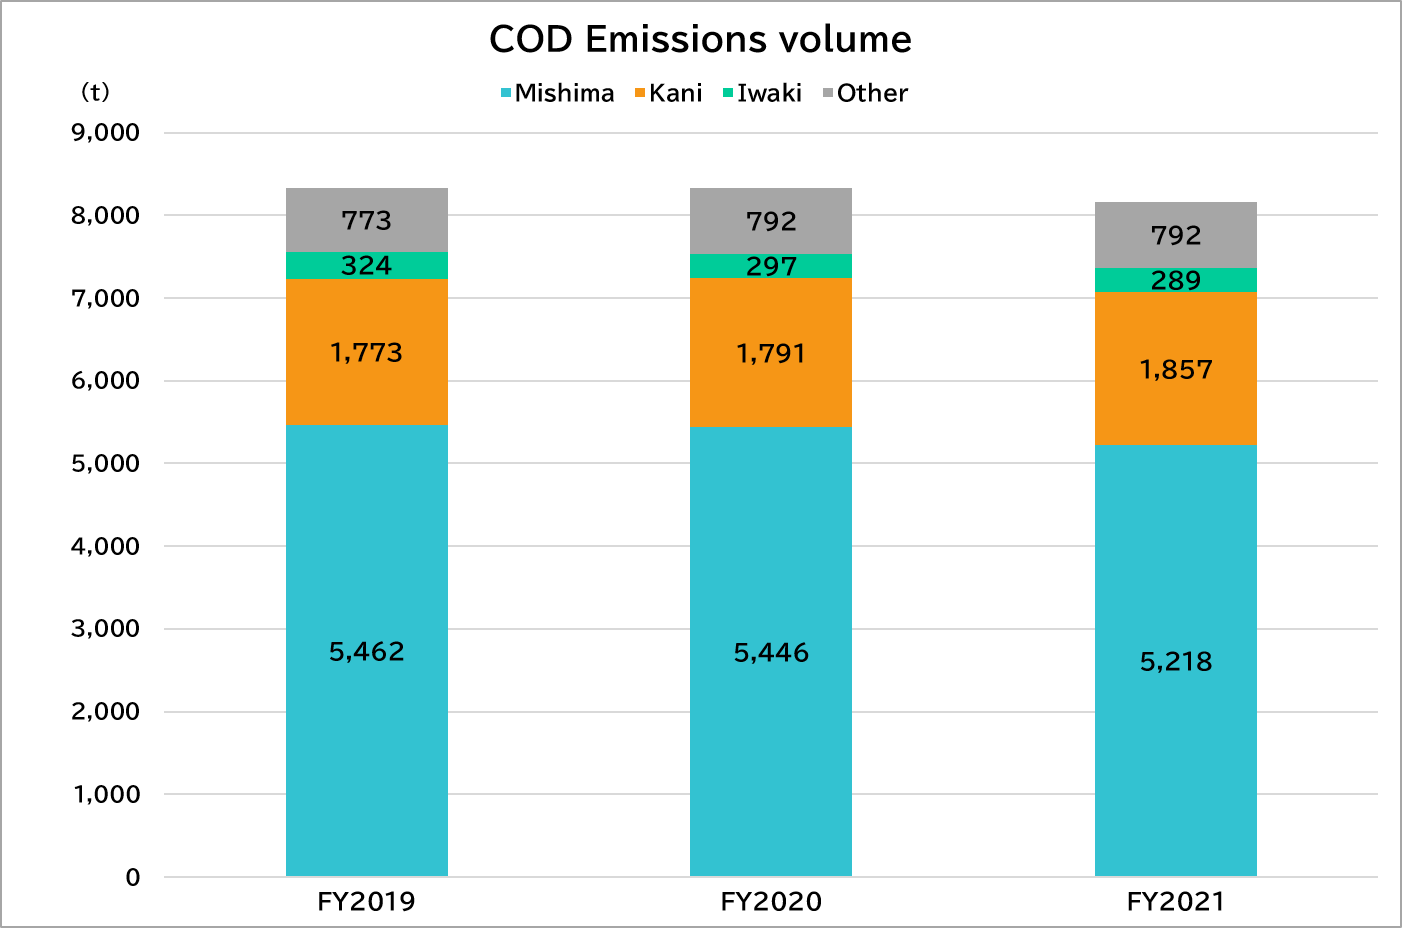
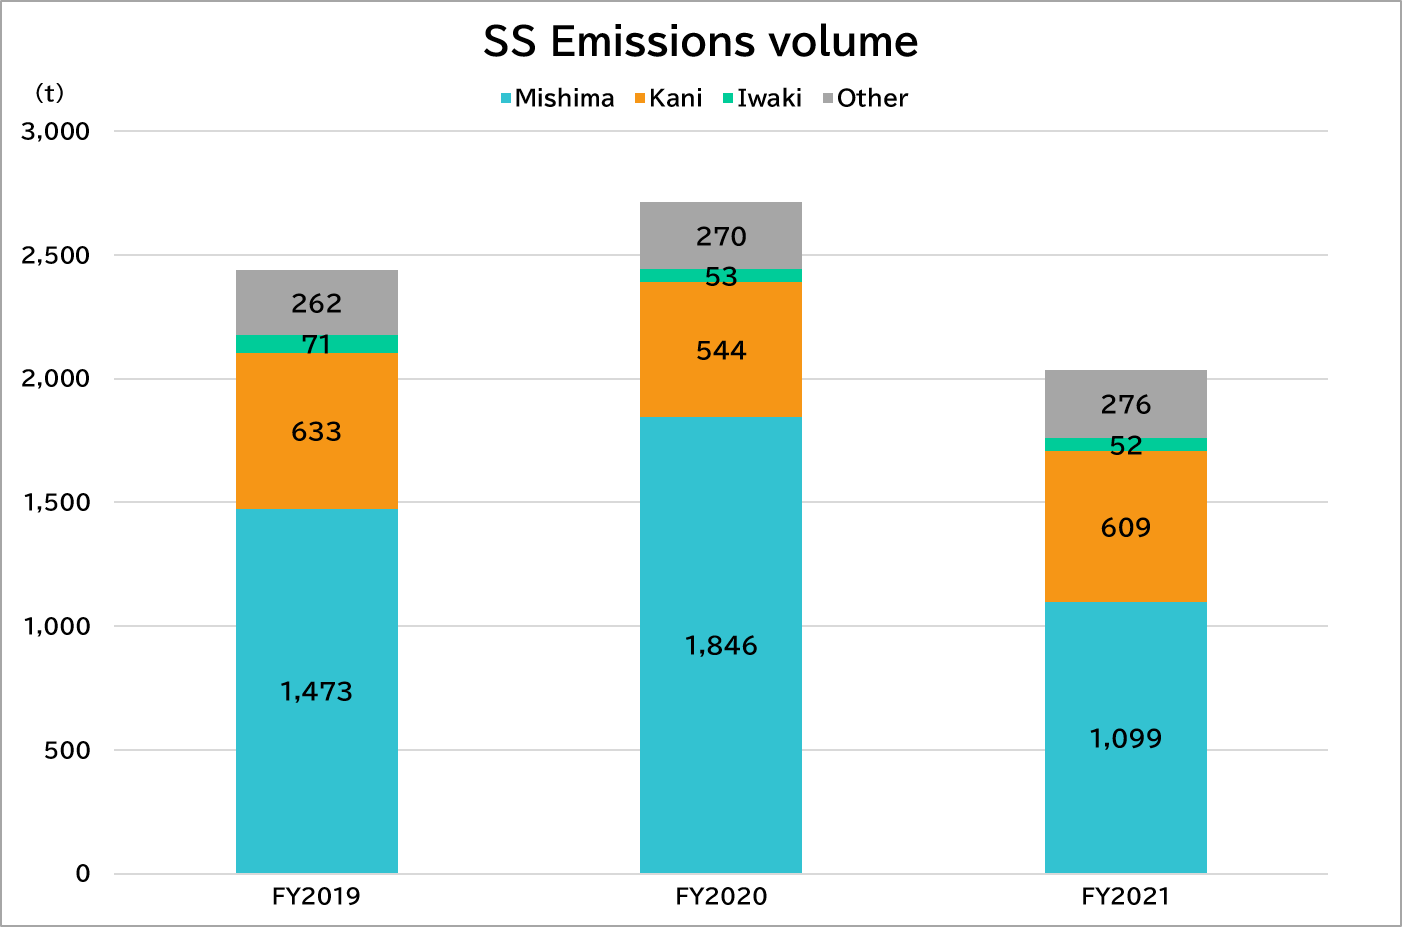
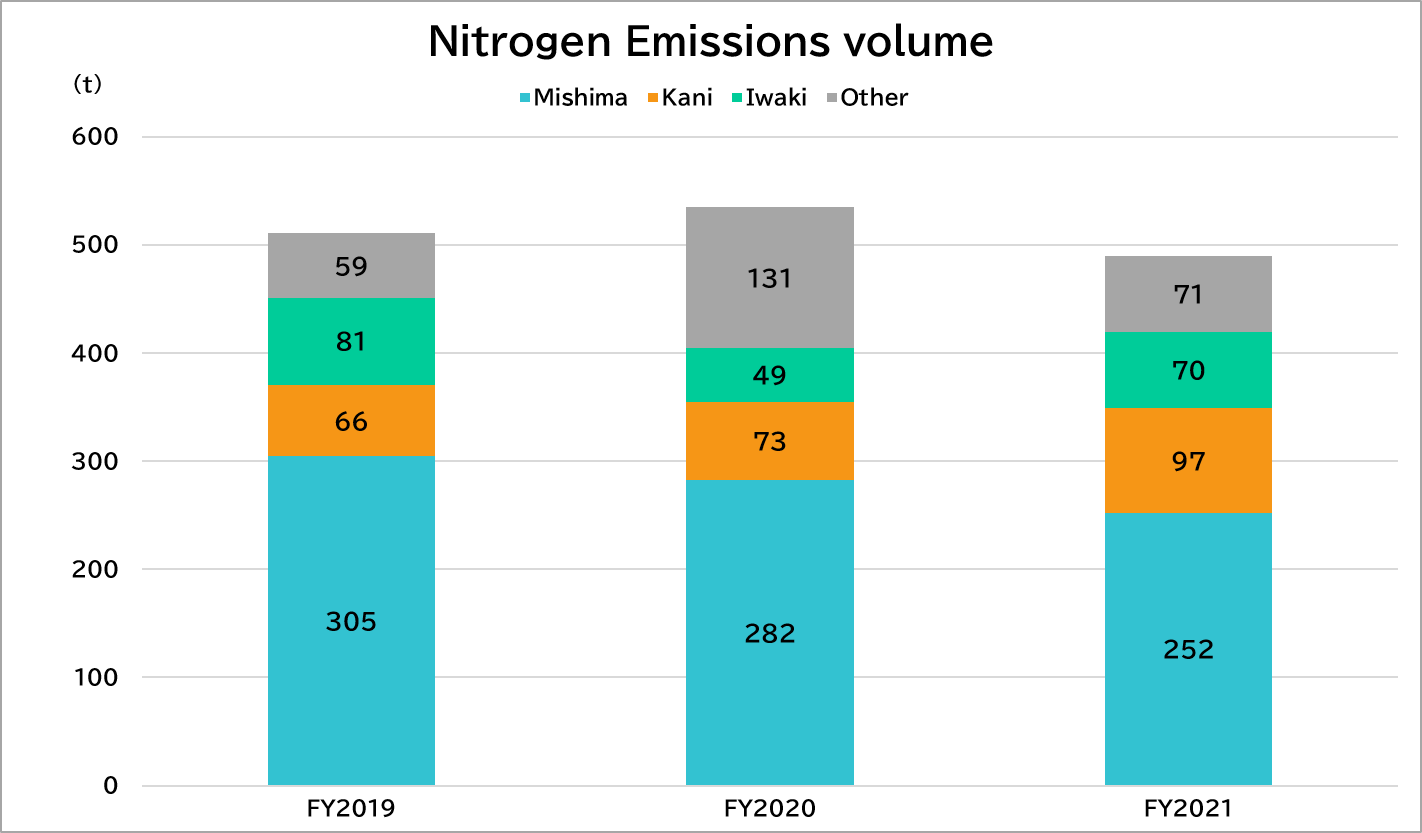
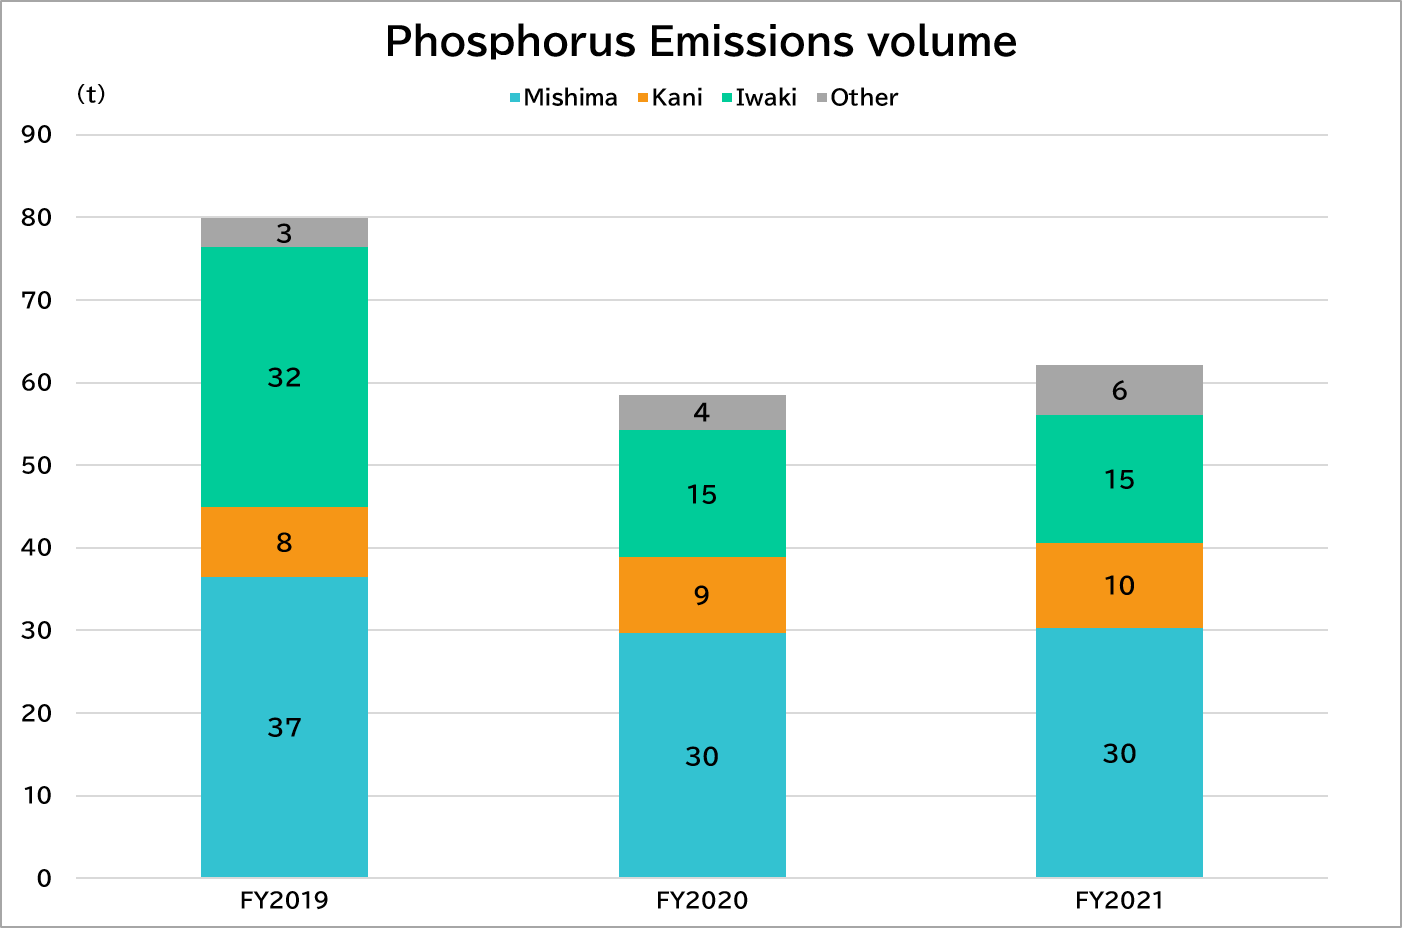
[COD] Chemical Oxygen Demand: The amount of oxygen required to decompose organic contaminants into carbon dioxide, and signifies the total amount of organic material in the sea. The higher the value, the higher the amount of pollution.
[SS] Suspended Solids: Refers to solid particles suspended in water. The higher the value, the more cloudy the water is. This is a cause of sediments in water bodies.
Initiatives of Daio Group Companies
Promoting the Use of Biomass Fuels
We are engaged in group-wide activities to convert to biomass fuels with lower CO2 emissions.
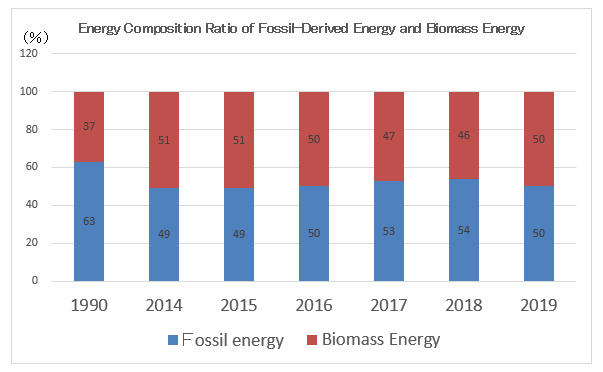
The Daio Group continues to introduce biomass boilers fired by fuels derived from waste materials, such as woodchips, paper trash, refuse plastic fuel (RPF), and waste tires. As a result of promoting group-wide conversion from boilers fired by fossil fuels such as coal and heavy oil to boilers fired by non-fossil fuels (biomass energy), the biomass energy ratio of the Daio Group increased from 37% in FY1990 to 50% in FY2019.
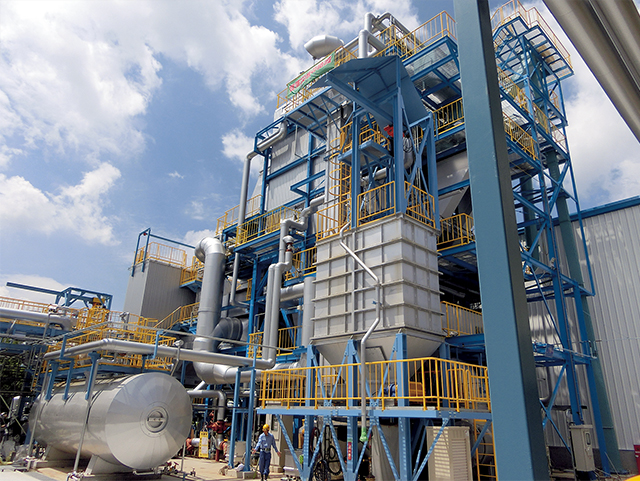
◆ Energy Composition Ratio of Fossil-Derived Energy and Biomass Energy
Promoting the Use of Renewable Energy
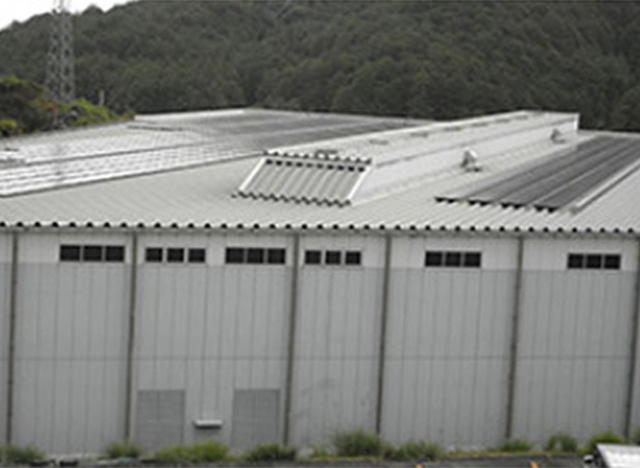
The Daio Group is reducing its CO2 emissions by installing solar power facilities as a part of its environment activities. Iwaki Daio Corporation is working to deploy renewable energy sources with low environmental impact. The company began operating a solar power facility at the end of November 2014 in line with reinforcement of its containerboard production facility, which was relocated and rebuilt in August 2014. In 2020, the facility generated 241 megawatt-hours of electricity and reduced CO2 emissions by 110 tons. The Fukushima Factory of Elleair Products Co., Ltd. installed a solar power facility on the roof of its warehouse with support from Fukushima Prefecture’s business siting assistance subsidy and started operations in January 2017. For the year, it generated 53 megawatt-hours of electricity and reduced CO2 emissions by 27 tons. The solar power facility at Otsu Paperboard Co., Ltd.’s Ishiyama Distribution Center generated 268 megawatt-hours during the year, which reduced CO2 emissions by 91 tons.

Environmental Accounting
- ①Scope of calculations: In addition to the Mishima Mill and the Kani Mill of Daio Paper Corporation, and Iwaki Daio Corporation, forestry-related operations of Forestal Anchile Ltda., our Group company in Chile, were included within the scope of calculations for environmental conservation costs and benefits.
- ②Target period: FY2020 (from April 1, 2020 to March 31, 2021)
- ③Calculations were performed using “Environmental Accounting Guidelines 2005” released by the Ministry of the Environment.
Environmental Conservation Costs
(Millions of Yen)
| Category | Details of major activities | Investment | Cost | |
| (1)Business area cost | 6,056 | 27,370 | ||
| Itemization | ①Pollution prevention cost | Effluent treatment facilities, deodorizing/exhaust gas desulfurization facilities, ECF, etc. | 723 | 5,027 |
| ②Global environmental conservation cost | Overseas forestation, maintenance and management of company-owned forests, energy-saving | 3,988 | 10 | |
| ③Resource circulation cost | Waste disposal/recycling waste as materials, effective use of recovered paper and other resources | 1,345 | 22,334 | |
| (2)Upstream/downstream cost | Recycling cost, low-sulfur fuel purchase cost (difference), etc | 1,599 | ||
| (3)Administration cost | Management cost of ISO14001, cost of employee education, environmental impact measurement, etc | 282 | ||
| (4)R&D cost | Development of products, such as environmentally friendly brands, for environmental conservation, etc | 69 | ||
| (5)Social activity cost | Various volunteer activities, organization support, environmental report, etc. | 59 | ||
| (6)Environmental remediation cost | Pollution load charges (SOx) | 160 | ||
| Total | 6,056 | 29,541 | ||
Environmental Conservation Benefits
| Categories of environmental conservation benefits | Environmental load items | Unit | FY2018 | FY2019 | FY2020 | Change from the previous fiscal year | |
| (1)Benefit corresponding to business area cost | ①CO2 emission volume | CO2 emission volume | 1,000t | 3,170 | 2,978 | 2,889 | Decreased by 89 t |
| ②Reduction of air-pollution substances | Sulfur oxide emission volume | t | 1,291 | 1,229 | 1,304 | Increased by 75 t | |
| Nitrogen oxide emission volume | t | 6,362 | 6,199 | 6,161 | Decreased by 38 t | ||
| Dust emission volume | t | 375 | 435 | 293 | Decreased by 142 t | ||
| ③Reduction of water-pollution substances | Volume of waste water | 1,000m³ | 125,522 | 129,287 | 131,441 | Increased by 2,154,000 m3 | |
| COD emission volume | t | 7,291 | 7,559 | 7,534 | Decreased by 25 t | ||
| SS emission volume | t | 2,078 | 2,177 | 2,443 | Increased by 266 t | ||
| Nitrogen emission volume | t | 447 | 451 | 404 | Decreased by 47 t | ||
| Phosphorus emission volume | t | 48 | 77 | 54 | Decreased by 23 t | ||
| ④Promotion of overseas forestation | Overseas forested area | ha | 28,200 | 27,950 | 29,000 | Increased by 1,050 ha | |
| ⑤Reduction of industrial waste | Volume of industrial waste generation | 1,000t | 339 | 311 | 267 | Decreased by 44,000 t | |
| (2)Benefit corresponding to upstream/downstream cost | ①Promotion of recovered paper usage | Volume of recovered paper usage | 1,000t | 1,729 | 1,732 | 2,232 | Increased by 500,000 t |
Economic Benefits of Environmental Conservation Measures
(Millions of Yen)
| Details of benefits | Amount |
| Cost reduction from energy saving | 432 |
| Cost reduction from decrease in fossil fuel usage | – |
| Reduction of disposal cost due to effective use of waste | – |
| Cost reduction through the effective use of hard-to-recycle recovered paper | – |
| Total | 432 |

